![]()
NGLVieweR - Visualize and interact with Protein Data Bank (PDB) and structural files in R and Shiny
Click here to view a Shiny application integrating most features of NGLVieweR.
Note: The app can take 1-2 minutes to load on your first visit while the browser downloads and starts the WebAssembly runtime.
Description
NGLvieweR provides an R interface to the NGL.js JavaScript library. It can be used to visualize and interact with protein data bank (PDB) and structural files in R and Shiny applications. It includes a set of API functions to manipulate the viewer after creation and makes it possible to retrieve data from the visualization into R.
Installation
You can install the released version of NGLVieweR from CRAN with:
install.packages("NGLVieweR")And the development version from GitHub with:
install.packages("remotes")
remotes::install_github("nvelden/NGLVieweR")
Basics
You can load a PDB (or any other supported structural file) directly or use a PDB code of a structure on RCSB.org. The below minimal example loads the PDB file and displays the structure in a “cartoon” representation.
#Load local pdb file
NGLVieweR("C:/7CID.pdb") %>%
addRepresentation("cartoon")

#Load protein by PDB code
NGLVieweR("7CID") %>%
addRepresentation("cartoon")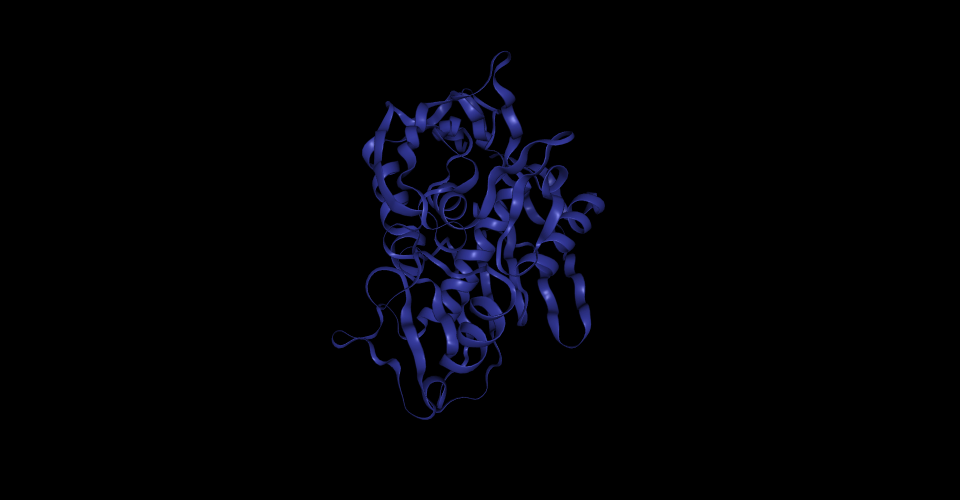
Functionality
There are functions provided to:
- Overlay different representation styles
- Alter the stage parameters (e.g. background, zoom- and rotation speed)
- Zoom to specific selections
- Add labels
- Add contacts between residues
- Auto rotate/rock
In Shiny apps, you can manipulate the NGLVieweR widget after creation using specific “API”” calls. Users can for instance add/remove representations, make snapshots, add labels or highlight specific regions. See the Get started section for a complete overview.