geneviewer - Gene Cluster Visualizations in R
geneviewer
geneviewer is an R package for plotting gene clusters and transcripts. It imports data from GenBank, FASTA, and GFF files, performs BlastP and MUMmer alignments, and displays results on gene arrow maps. The package offers extensive customization options, including legends, labels, annotations, scales, colors, tooltips, and more. To explore all features visit the package website.
Interactive Shiny Dashboard
Try the Gene Cluster Dashboard - a web interface that provides point-and-click access to geneviewer’s visualization features. (Allow 1-2 minutes for loading)
Installation
You can install the released version of geneviewer from CRAN with:
install.packages("geneviewer")And the development version from GitHub with:
# install.packages("devtools")
devtools::install_github("nvelden/geneviewer")
Usage
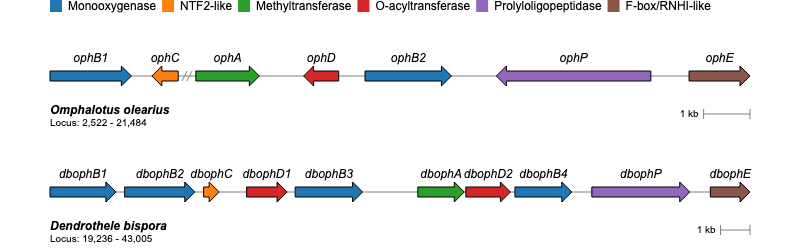
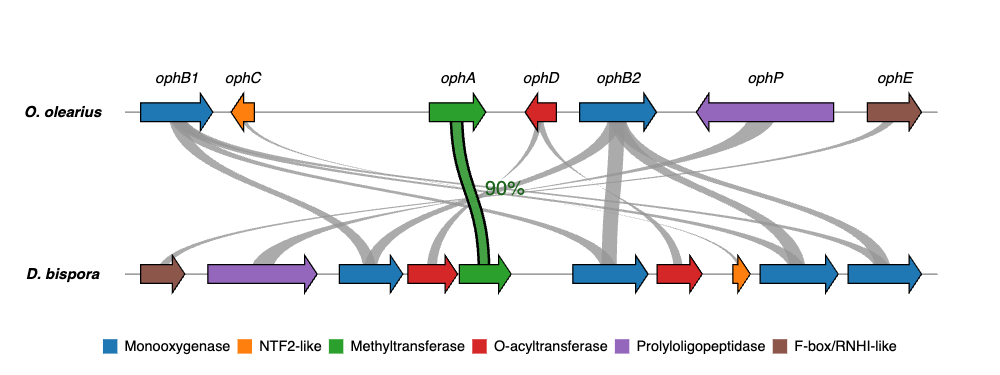
The below example demonstrates using geneviewer to plot a gene cluster on a genomic sequence, using the start and end positions of each gene. The genes are grouped by class and labels are added using the GC_labels function.
library(geneviewer)

# Data
gene_cluster <- data.frame(
  name = c("ophB1", "ophC", "ophA", "ophD", "ophB2", "ophP", "ophE"),
  start = c(2522, 5286, 9536, 12616, 13183, 19346, 20170),
  end = c(4276, 4718, 10904, 11859, 15046, 16016, 21484),
  class = c("Monooxygenase", "NTF2-like", "Methyltransferase",
  "O-acyltransferase", "Monooxygenase", "Prolyloligopeptidase",
  "F-box/RNHI-like")
)

# Chart
GC_chart(gene_cluster, group = "class", height = "100px") %>%
  GC_labels("name")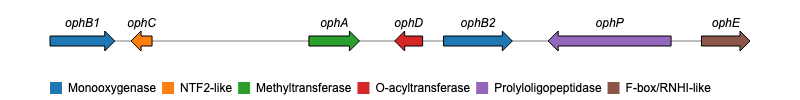
Examples
For additional examples and the corresponding code to create the plots, please visit the Examples section.
Issues
If you encounter any issues or have feature requests, please open an Issue.